Polymer Composite (Phase Separation)
Easy to Detect Phase Information for Composite Materials by Force Modulation Mode
Polymer blends of poly (styrene-isobutylene-styrene) and poly (styrene-co-maleic anhydride) have been investigated using the XE-100. This study examined the morphology and the phase dispersion characteristics of the polymer blend of SIBS and SMA at different compositions. Specifically, the morphology of the blended composition either consisted of a binary phase system of randomly dispersed particles embedded in a matrix or as a co-continuous phase. In both cases, the SMA and SIBS formed their own separate domains. In terms of mechanical properties such as stiffness, there were contrast changes in the FMM images which correlated to the micro-phase changes in the polymer blend.
Fractured samples were embedded in epoxy and polished to produce a smooth flat surface. A non-contact tip, stiffer than contact tips, on a silicon cantilever was used. The cantilever’s length and width was 125 μm and 35 μm, respectively. The cantilever had a resonant frequency of 325 kHz and a force constant of 40 N/m. Choosing the right cantilever is a critical factor in FMM.

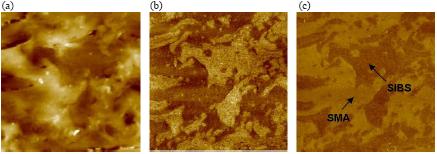
Figure 1. Images of microstructures for compounding polymer material (80% SIBS and 20% SMA, 40 μm size scan). (a) Topography, (b) amplitude image, and (c) phase image. Image courtesy of Bongwoo Kang, Dr. Jun Seok Lee and Prof. Changmo Sung, Univ. of Mass., Lowell.
Topographical information was obtained simultaneously with phase and amplitude force modulation data at optimized scanning conditions. Elasticity and stiffness differences on the surface can be distinguished using this method. Figure 1 and 2 show the mapping of these differences with different blend compositions.

Figure 2. Microstructures of composite material (60% SIBS and 40% SMA, 40 x 40 μm). (a) Topography, (b) amplitude image, and (c) phase image.
