Characterization of Graphene through Imaging Spectroscopic Ellipsometry
Introduction
Graphene consists of a sp²-hybridized atomic carbon crystal. Since it was first reported by Novoselov et al. (2004) it has been of increasing interest, because of unique physical properties and promising applications. First Graphene samples were fabricated by micro mechanical cleavage of graphite. Currently, technical processes have been established to produce graphene on large areas.
To achieve a better control of thickness and properties , a characterization in the micrometer scale is required. The characterization should include the thickness and the number of layers, respectively. Also the optical properties are essential.
Imaging Ellipsometry is a fast and easy way to characterize localized exfoliated graphene
Delta map Air | Graphene | SiO2 | Si
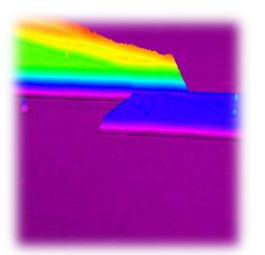
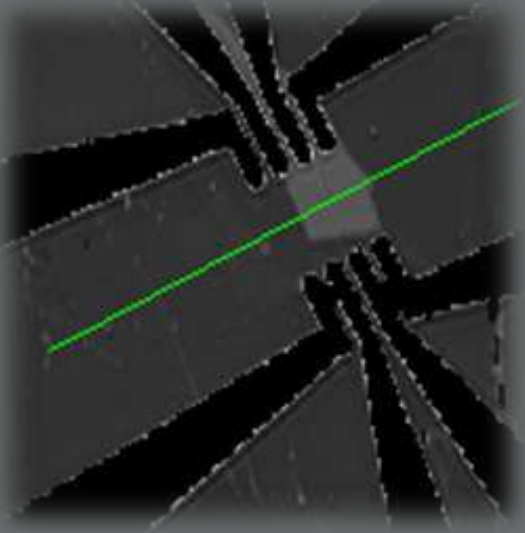
Imaging ellipsometry
Ellipsometry is a sensitive optical method, which has been used for about a hundred years to derive information about surfaces. It makes use of the fact that the polarization state of light may change when the light beam is reflected from a surface. If the surface is covered by a thin film (or a stack of films), the entire optical system of film & substrate influences the change in polarization. It is therefore possible to deduce information about the film properties, especially the film thickness.
The name ”ellipsometry” implies that it has to do something with an ”ellipse”: The elliptical state of polarization, where the electrical field vector travels along an ellipse when observed at a fixed point in space, is the most general state of polarization The basic components of an ellipsometer are: a light source, some optical components to modify the polarization and a detector. By using imaging technology, one can extend the classical ellipsometer to a new form of visualization tool or a microscope with extreme sensitivity to thin films.
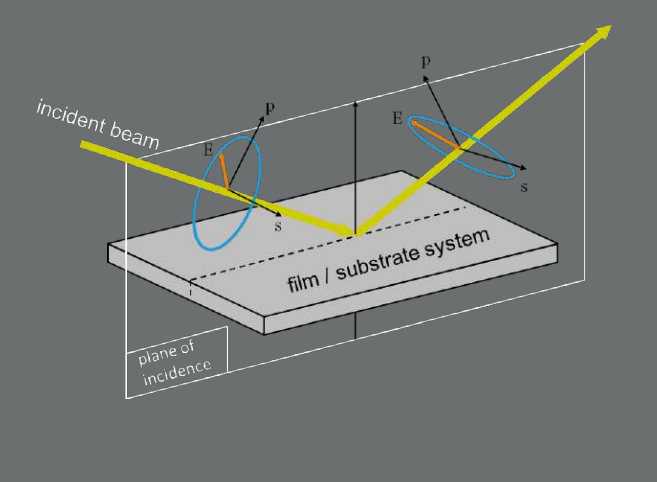
Figure 1. State of polarization of a light beam reflected at a surface
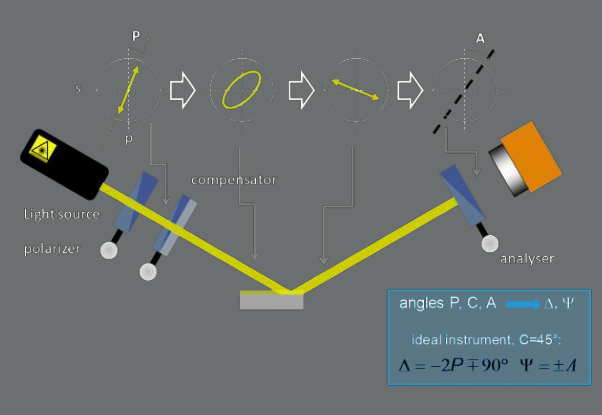
Figure 2. Principle of nulling ellipsometry.
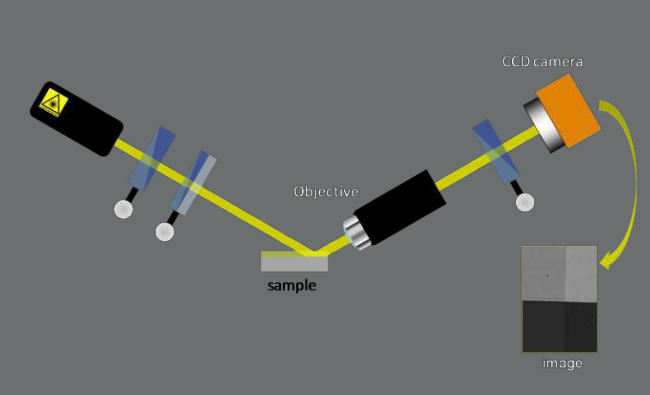
Figure 3. Setup of an imaging ellipsometer.
Maps with the highest lateral resolution
Delta and Psi maps are based on a number of images taken at changing orientations of the polarizer and analyzer (Fig. 4 a). In general, the ellipsometric angles were obtained by analyzing the minimum in grayscale distribution for each pixel (Fig. 4b).
Albrektsen et al. (2012) characterized few layer graphene by different imaging methods and showed clearly the capability of imaging ellipsometry to distinguish between single, double and few layer graphene.
Matković et al. calculated based on Delta maps at different wavelength the thickness of the graphene layer and a water interlayer independent from each other.
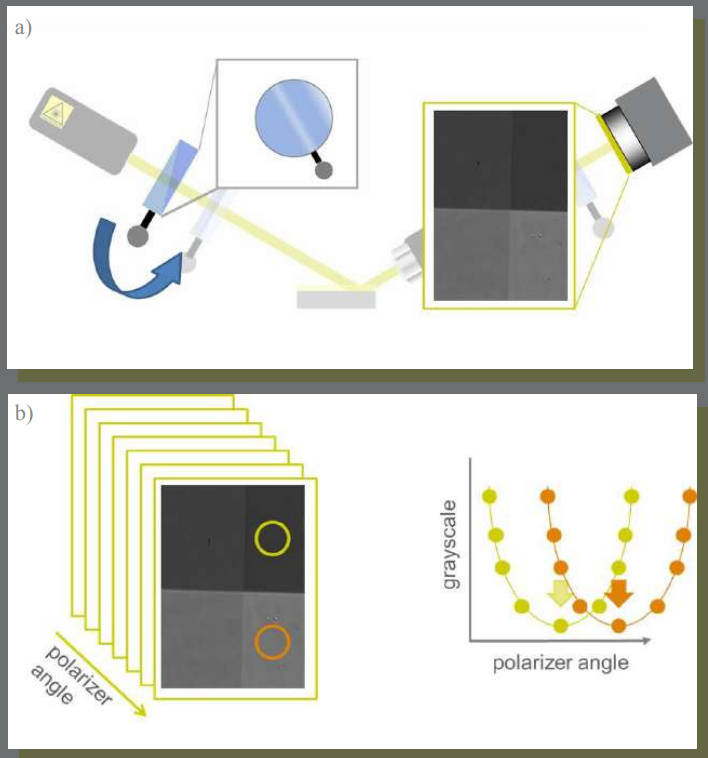
Figure 4. Scheme of recording a map.
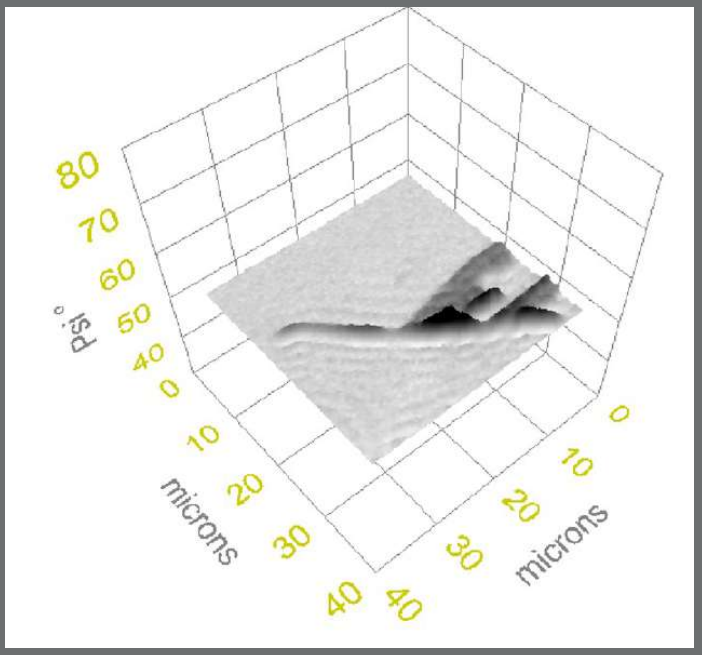
Figure 5. Psi map of a graphene flake.
Ellipsometric enhanced contrast
Based on the nulling concept, the optical setup of an imaging ellipsometers offers the option to set the optical components in a way to enhance the contrast of the micrograph. Matković published micrographs of graphene flakes on different SiO2|Si substrates.
Wurstbauer et al. (2010) published ellipsometric contrast micrographs of few-layer graphene on a GaAs substrate. The contrast was optimized for the graphene layer such that the adhesive tape residues vanish, while in a second image the contrast of the immediate vicinity is enhanced.
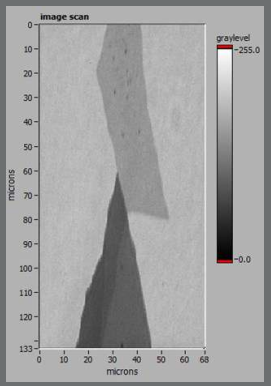
Figure 6. Ellipsometric contrast micrograph of graphene flakes.
New: Imaging NIR-ellipsometry
Based on new developments, spectra with higher spectral resolution are available in the NIR up to 1700 nm. For wavelength above 1000 nm an InGaAs cooled FPA detector was included.
Delta- and Psi maps of a graphene flake are recorded and show significant different behavior than the substrate. The technique is promising to obtain information about Drude adsorption with a lateral resolution of few micro meters. It will improve the understanding of the dielectrical properties of graphene and of the graphene substrate interactions.
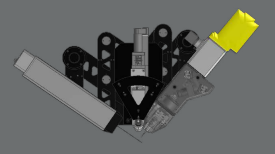
Figure 7. Technical drawing of setup with NIR camera.

Figure 8. Delta– and Psi-maps of a graphene flake at selected wavelength in the NIR.
Spectra at the smallest regions of interest (ROI)
One unique feature of imaging ellipsometry is the option of regions of interest. Unlike conventional ellipsometers that illuminate a single microspot and collect data for that one spot at a time, Imaging ellipsometers imaging the illuminated area onto a 2D array detector for a million or more simultaneous measurements. This facilitates ROI by enabling pixel selection.
The first wavelength spectra measured by the use of a ROI on single layers graphene were published by Wurstbauer et al. Matković et al. identified the Fano resonace based on spectra, measured with the ROI concept.
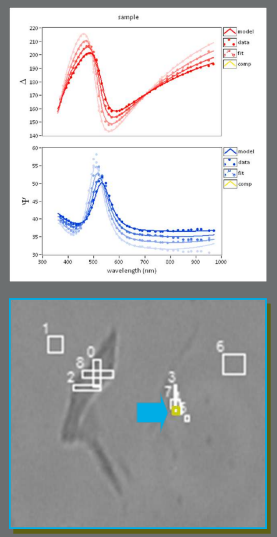
Figure 9. Wavelength spectra of Delta and Psi at different angle of incident.
The new nanofilm_ep4
The nanofilm_ep4 is based on a new frame for more free space and rigidity. It has an integrated Z-lift with higher accuracy; a new EP4 Align Sensor including the detection of the z-position and a new Instrument Alignment (instead of sample alignment) that enables the alignment on large samples like troughs, production line, etc.. Other improvements involve the new modular software concept including the optical modeling, the instrument control, and the data studio.
The new “Ultra_Objective”-Imaging optics offers fully focused field-ofview and fast mapping in real time. Imaging spectroscopic ellipsometry is improved with a continuously tunable, high throughput monochromator and a new light source (laser-driven Xe plasma, ca. 4 times more light for better SNR) for improved precision.
The setup offers new possibilities for the technical integration of other techniques like AFM, QCM, Terahertz spectroscopy or even customized solutions.

Literature
Matković et al. (2012) Spectroscopic imaging ellipsometry and Fano resonance modeling of graphene. J. Appl. Phys. 112, 123523
Albrektsen et al. (2012) High resolution imaging of few-layer graphene. J. Appl. Phys. 111, 064305 ellipsometry:
Wurstbauer et al. (2010) Imaging ellipsometry of graphene. Appl. Phys. Lett. 97, 231901
