Imaging Spectroscopic Ellipsometry and Spectral Reflectometry with Ellipsometric Contrast
Sebastian Funke Niklas Reineking Dirk Hönig
Two Methods for the Optical Characterization of 2D-Materials.
Introduction
|
Ellipsometry is a sensitive optical method, which has been used |
 |
Imaging Ellipsometry
|
The development of imaging ellipsometry, |
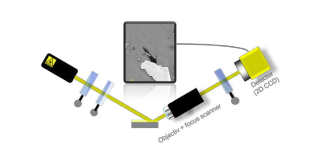
Setup of an imaging ellipsometer including objective and 2D CCD |
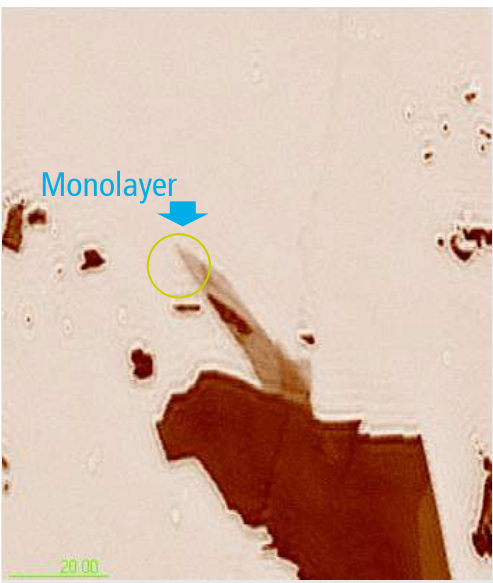
Spectroscopic Imaging Ellipsometry on Exfoliated Micro Crystals
|
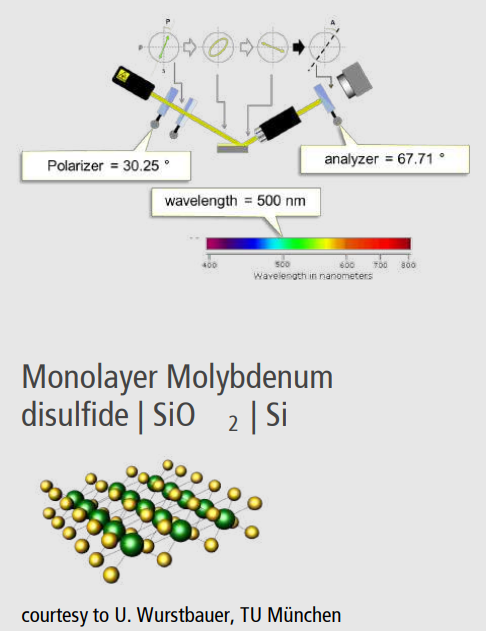
Ellipsometric enhanced contrast by optimized polarizer and analyzer angle at selected wavelength and angle of incidence.
|
  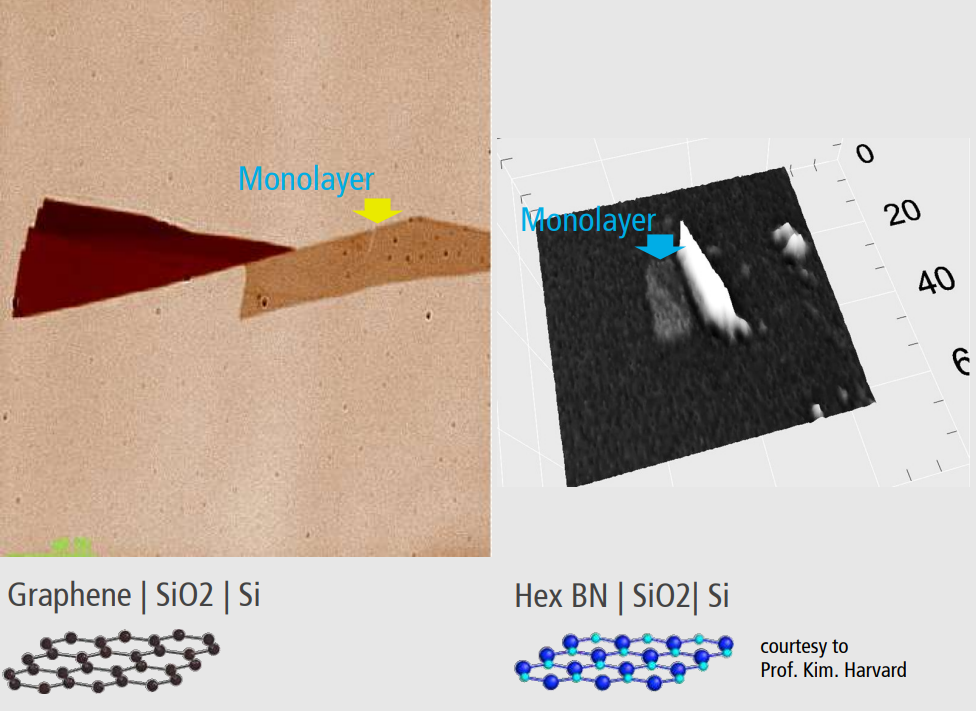 |
|
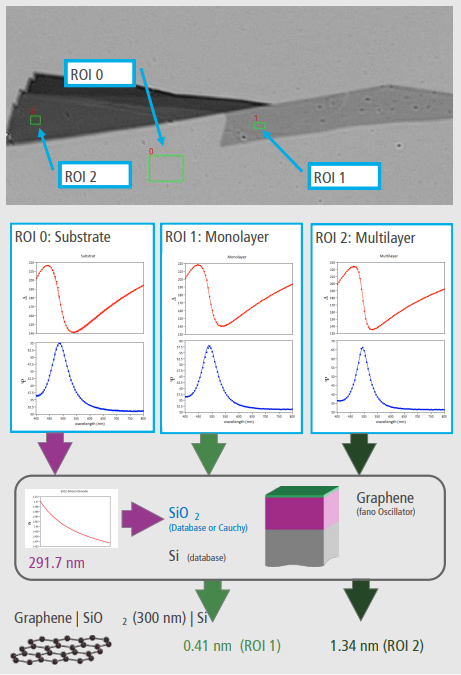
Regions of Interest (ROI) concept for ellipsometry on smallest flakes |
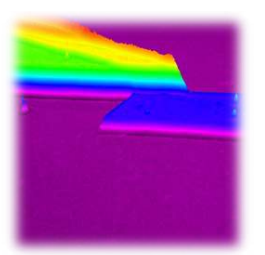
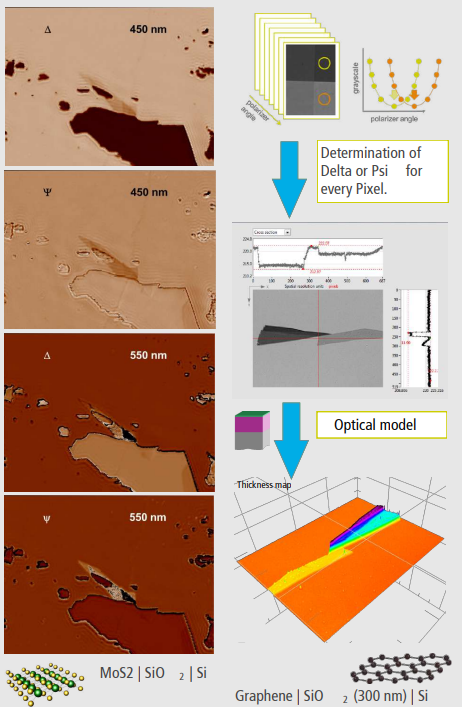
Microscopic mapping of Delta and Psi. |
 |
 |
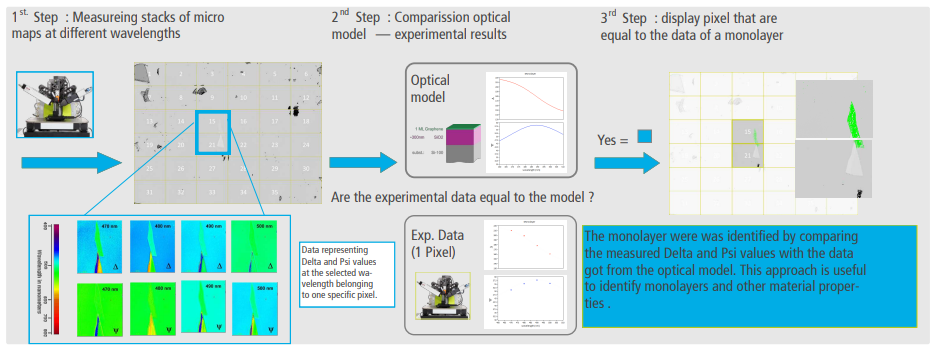
Automatic Localization & Identification of microcrystallites
Spectroscopic reflectometry with ellipsometric contrast for process control applications
Here, we present a setup that allows the acquisition of about 1000 spectroscopic spectra per second with a thickness sensitivity- of less than 0.5 nm. This becomes possible by comparing the sample with a similar reference sample. Due to the orientation of the reference (see Fig. 1) it acts as an ideal compensator
for all wavelengths. Hence no compensator is required. If the sample is equal to the reference, the outgoing light is linearly polarized and can extinguished with a crossed analyzer. If there’s any difference between the sample and reference, the light becomes elliptically polarized, and the detected light flux increases. In order to maximize the rate of data acquisition, the analyzer is set to an off null-position.
During the measurement neither the polarizer - nor the analyzer - angle is changed, so the measurement speed is only limited by the intensity of the light source
and the processing speed of the spectrometer.

