Phase Imaging of Sample Elasticity
Phase Imaging / Phase Detection Microscopy
Phase Imaging, also referred to as Phase Detection Microscopy (PDM), is another technique that can be used to map variations in surface properties such as elasticity, adhesion, and friction. Phase Imaging can be conducted while a Park AFM operates in other modes, such as True Non-Contact AFM, intermittent-contact AFM (IC-AFM), or MFM mode. Phase Imaging can also be collected while a Force Modulation Microscopy (FMM) image is being taken.

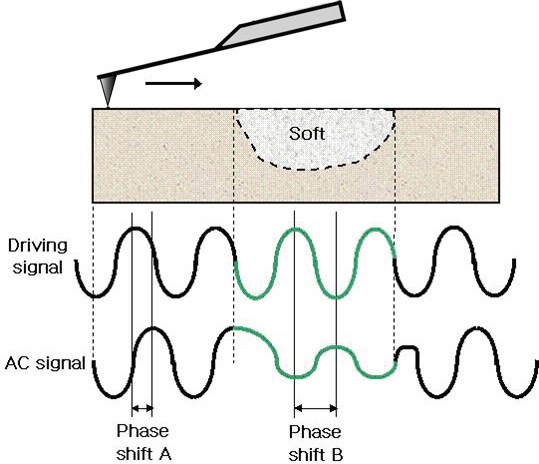
Figure 1. The phase lag changes depending on the mechanical properties of the sample surface.
Phase Imaging refers to the monitoring of the phase lag between the signal that drives the cantilever oscillation and its output signal as shown in Figure 1. Changes in the phase lag reflect changes in the mechanical properties of the sample surface. The system's feedback loop operates in the usual manner using changes in the cantilever's deflection or vibration amplitude to measure sample topography. The phase lag is monitored while the topographic image is being taken so that images of topography and material properties can be collected simultaneously.
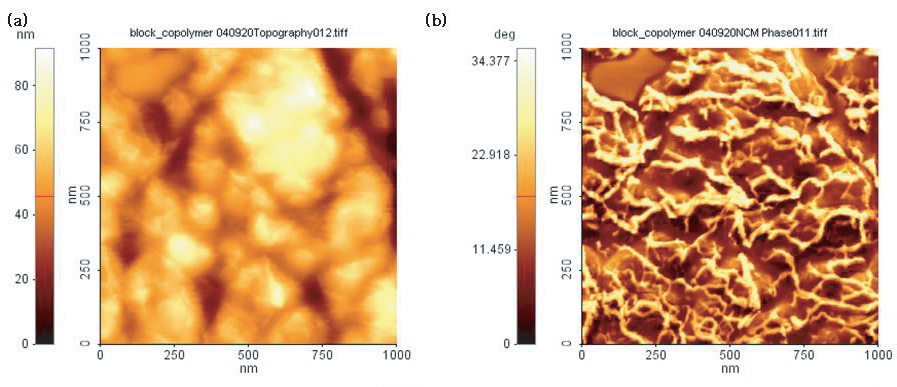
One application of phase detection is to obtain material properties information, especially for samples whose topography is best measured using True Non-Contact™ mode rather than Contact mode(see True Non-Contact™ ode). For these samples, Phase Imaging is useful as an alternative to FMM, which uses Contact mode to measure topography. Figure 2 shows a topographic True Non-Contact™ mode image (a) and a phase image(b) of a block co-polymer. Phase Imaging provides complementary information to the topography image, revealing the variations in the surface properties of the block co-polymer.

Figure 2. (a) Non-contact AFM image and (b) phase image of block co-polymers, collected simultaneously. Field of view 1 μm × 1 μm.
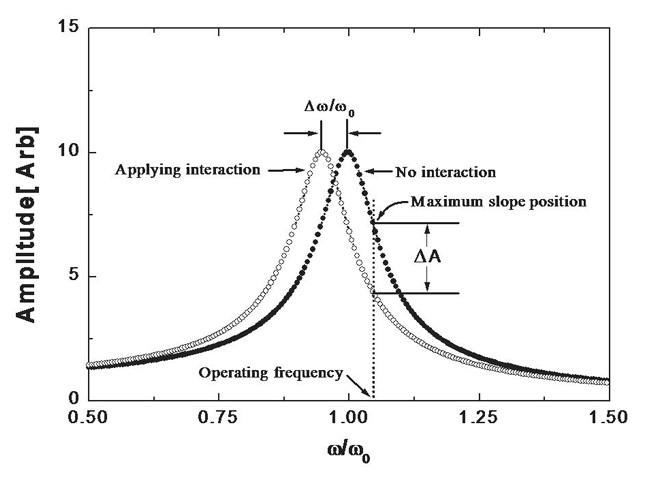
When Park AFM operates in True Non-Contact™ mode, three signals are monitored: topography, NCM amplitude, and NCM phase. Consider a cantilever which oscillates in free space. When the cantilever approaches a sample, the amplitude decreases and the phase shift occurs relative to the oscillation signal in free space, as shown in Figure 3.

Figure 3. Resonance curve of a cantilever oscillation shifts as it approaches a surface
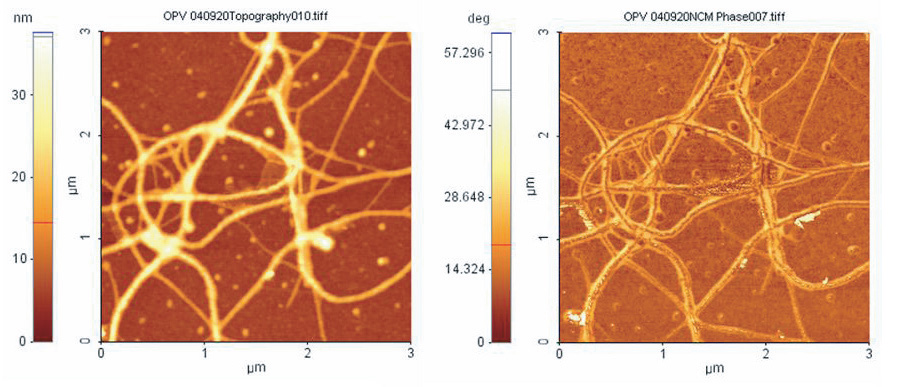
To make a cantilever follow the surface topography in True Non-Contact™ mode, we can use amplitude or phase as the feedback parameter. If the amplitude is the only feedback parameter used, the amplitude change should be almost negligible, but the phase change increases during imaging. If you use both amplitude and phase to feedback the Z-scanner during imaging, you will compensate the phase change along with the amplitude change. As a result, the amplitude change could increase while the amount of phase change decreases relative to that of the amplitude feedback only. Since True Non-Contact™ mode with Park AFM feedbacks both amplitude and phase, aphase image will have the highest contrast when its True Non-Contact™ mode uses amplitude feedback only (a user can turn on the amplitude feedback via the NCM frequency sweep box in the control software). Figure 4 shows a topographic True Non-Contact™ mode image (a) and a phase image(b) of an OPV polymer.

Figure 4. (a) True Non-Contact AFM image and (b) phase image of OPV polymers, collected simultaneously. Field of view 3 μm × 3 μm.
